April 20, 2026
Offerwall eCPM Benchmarks by Vertical — 2026 Data Report
Offerwall eCPM is a metric often used by app publishers to evaluate the effectiveness of the revenues received…
Read more
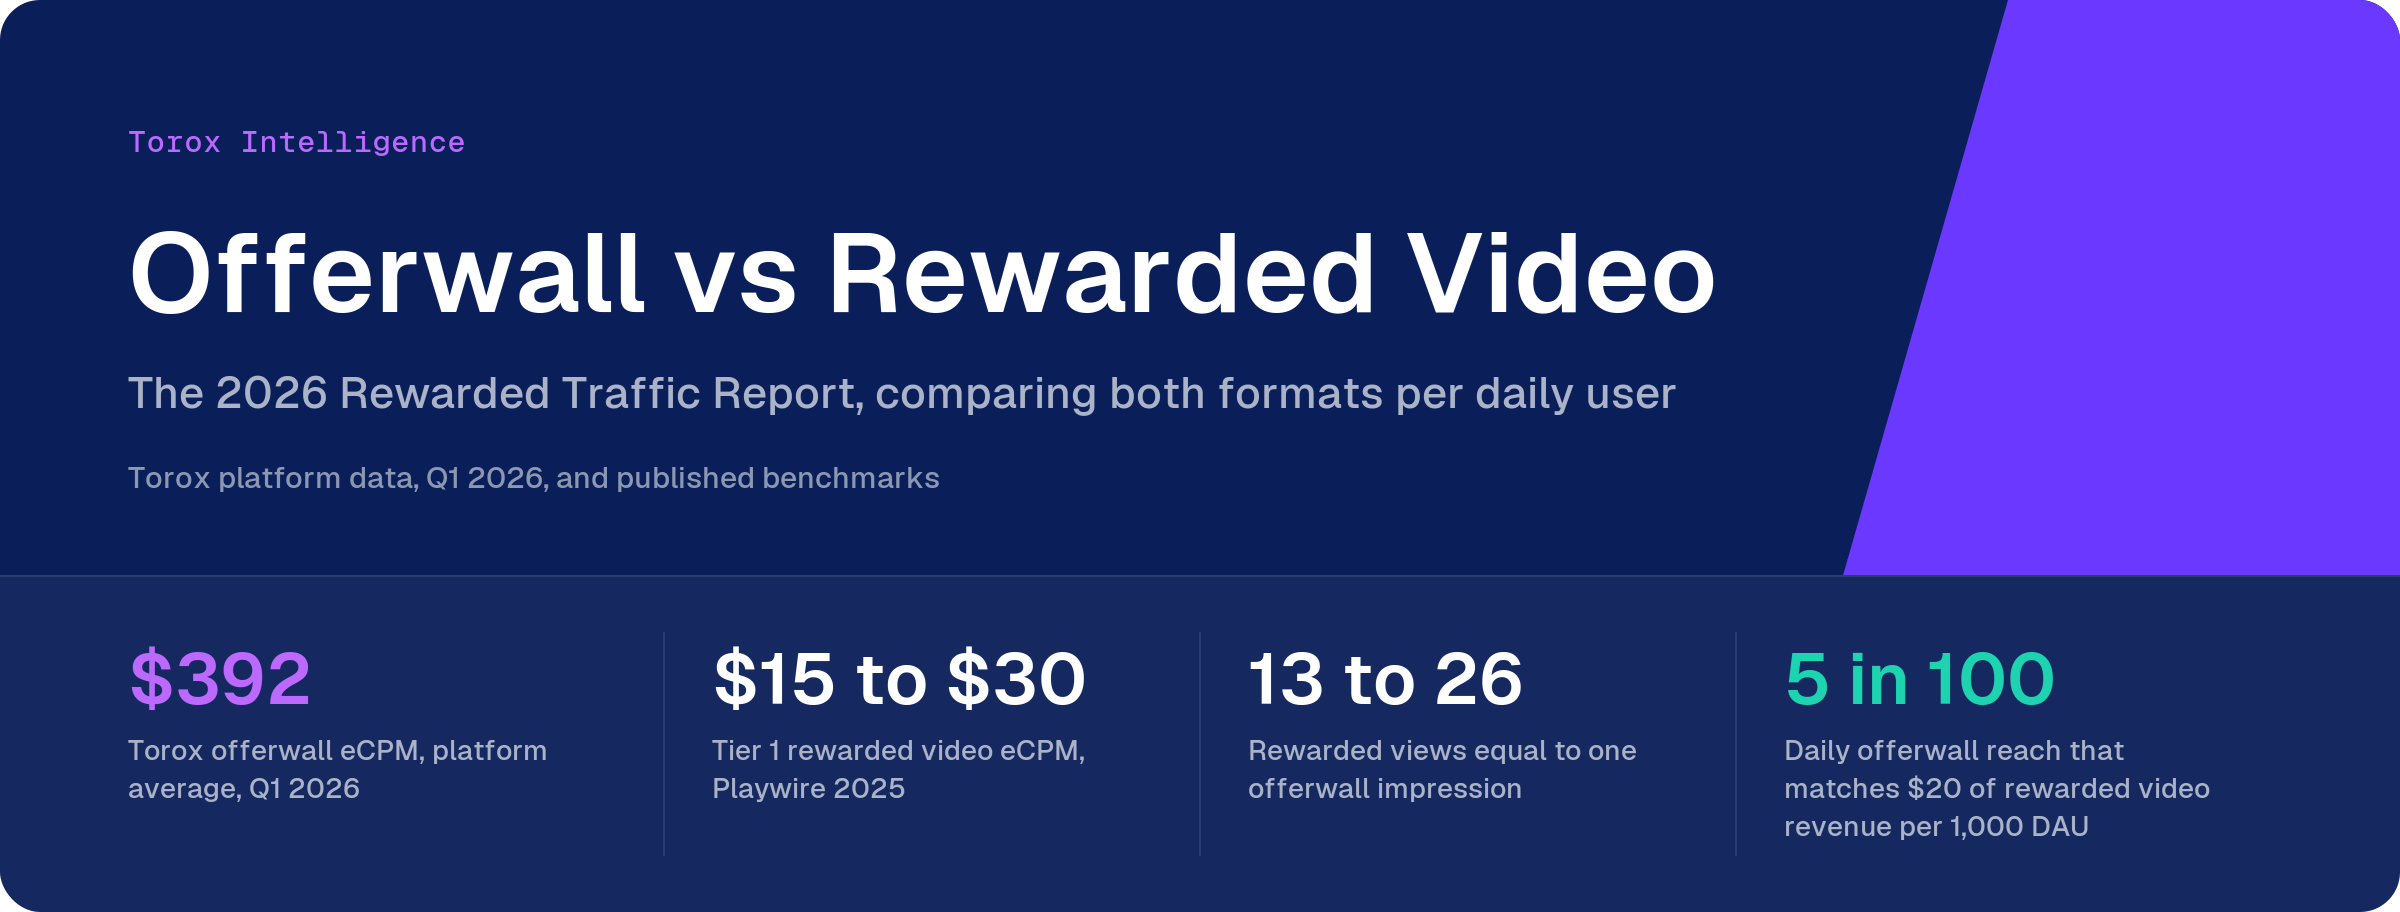
Offerwalls and rewarded video price different units, so their eCPMs do not compare. Measured per daily user, they are two revenue lines that most apps can run together.
The decision metric is revenue per 1,000 daily users, measured against a holdout.
Neither format wins on eCPM alone, because each prices a different unit. Rewarded video earns $15 to $30 per 1,000 ad views in published Tier 1 benchmarks. An offerwall earned $25 to $899 per 1,000 offerwall impressions on the Torox network in Q1 2026. Compared on revenue per 1,000 daily users, most apps should run both.
Most comparisons put the two eCPMs side by side and name a winner. That test fails because a rewarded view and an offerwall impression are different events.
A view is one ad, watched by most users at a natural break. An offerwall impression is a visit to a menu of paid tasks, made by a smaller group that chose to open it.
Rewarded video sells a view; the offerwall sells an action. That difference sets the pricing model, the effort asked of the user and who carries the risk.
| Rewarded video | Offerwall | |
|---|---|---|
| Watches one ad, usually 15 to 30 seconds | What the user does | Opens a list of tasks and completes one |
| Views, or installs, depending on the buying model | What the advertiser pays for | A completed install, in-app event or account action |
| CPM, CPV, CPCV | Pricing models | CPI, CPE, CPA |
| Small and frequent | Reward to the user | Larger and less frequent |
| On the day of the view | When the publisher earns | When the action completes, which can be days after the visit |
| Placement, frequency caps | Main publisher levers | Entry points, trigger timing, offer mix |
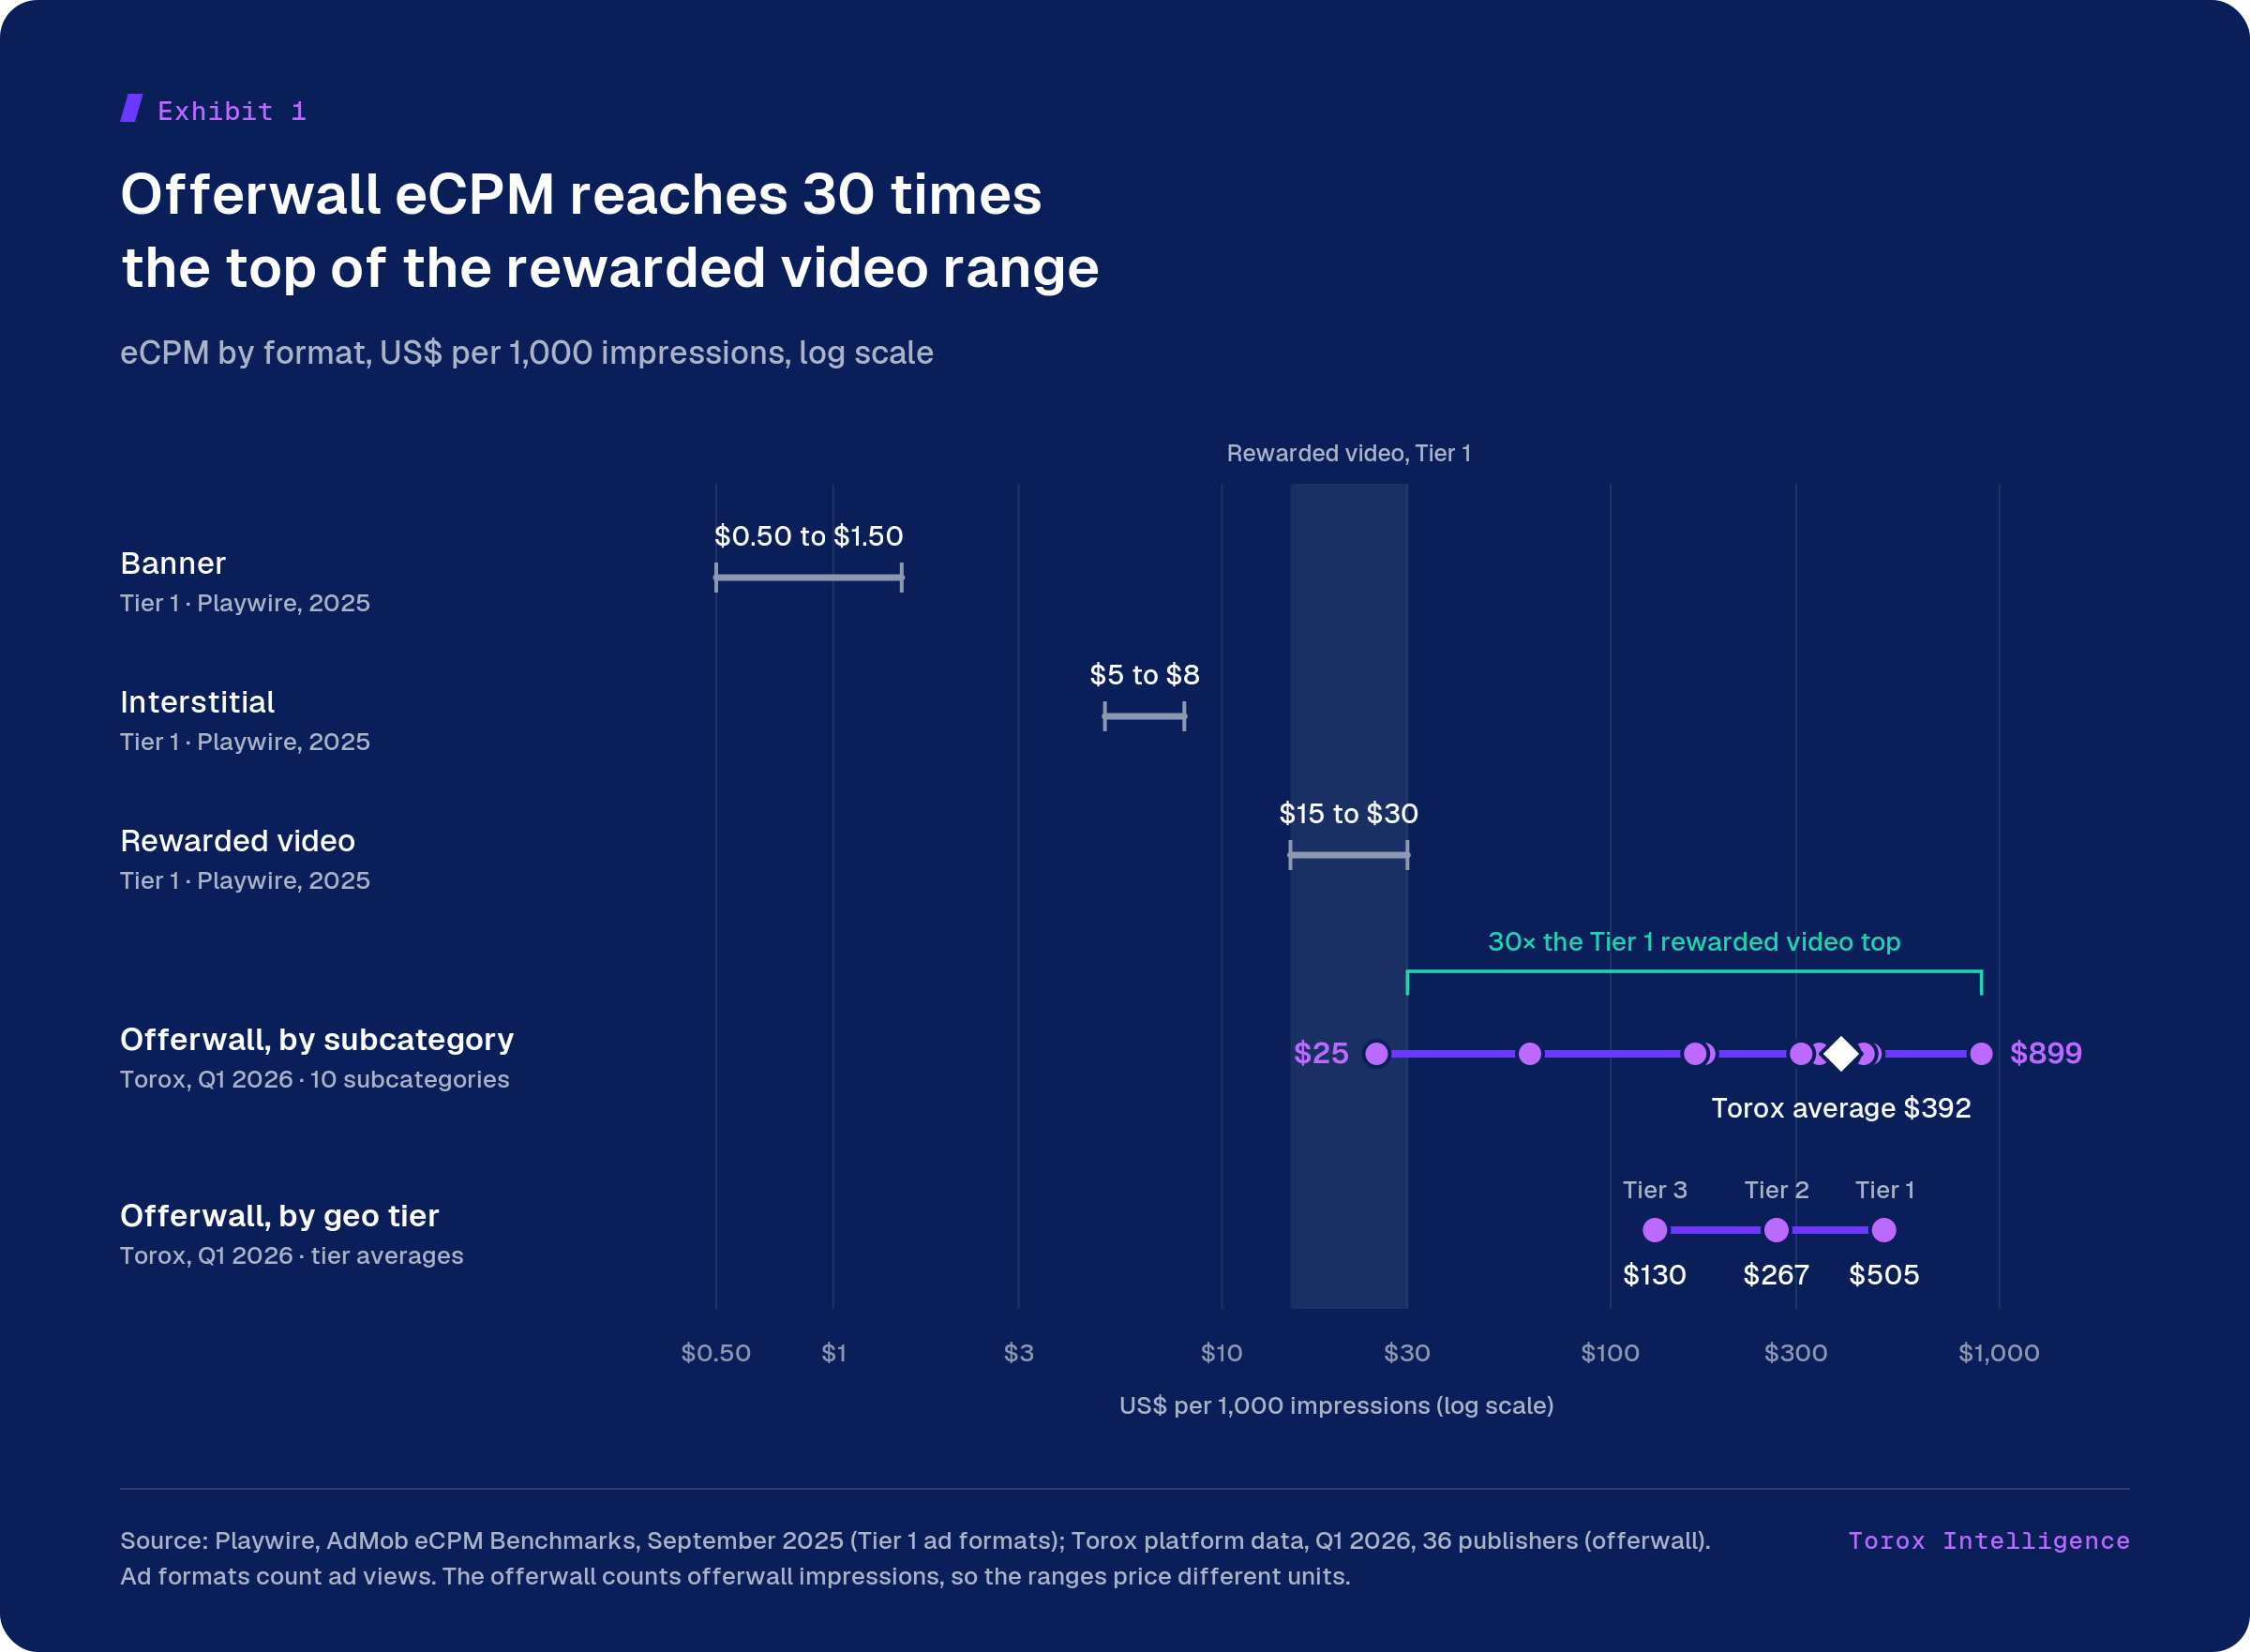
The lowest offerwall subcategory, surveys at $25, sits inside the Tier 1 rewarded video range. Every other subcategory prices above it. Earned wage access reaches $899, 30 times the $30 top of the range, though that figure comes from a single-publisher sample.
eCPM divides revenue by a count of impressions. For an offerwall, that count can mean offer clicks, wall impressions or users, and the same day of revenue reads as $19.60, $392 or $1,307.
| Daily count | Denominator | Revenue per 1,000 |
|---|---|---|
|
100,000
|
Daily active users |
$19.60Compares formats
|
|
5,000
|
Offerwall impressions |
$392
|
|
1,500
|
Offer clicks |
$1,307
|
A rewarded video line earning the same $1,960 from about 87,100 views reports a $22.50 eCPM. The two eCPMs differ 17 times, yet both lines earn $19.60 per 1,000 DAU. Only the per-user figure compares the formats.
Torox reports eCPM per 1,000 offerwall impressions. When a vendor quotes an offerwall eCPM, ask which count sits underneath it.
Revenue per 1,000 DAU is the product of three drivers: reach, frequency and price.
Reach is the share of daily users who see the format, frequency is the impressions each of them sees per day, and price is the eCPM on the format’s own impressions.
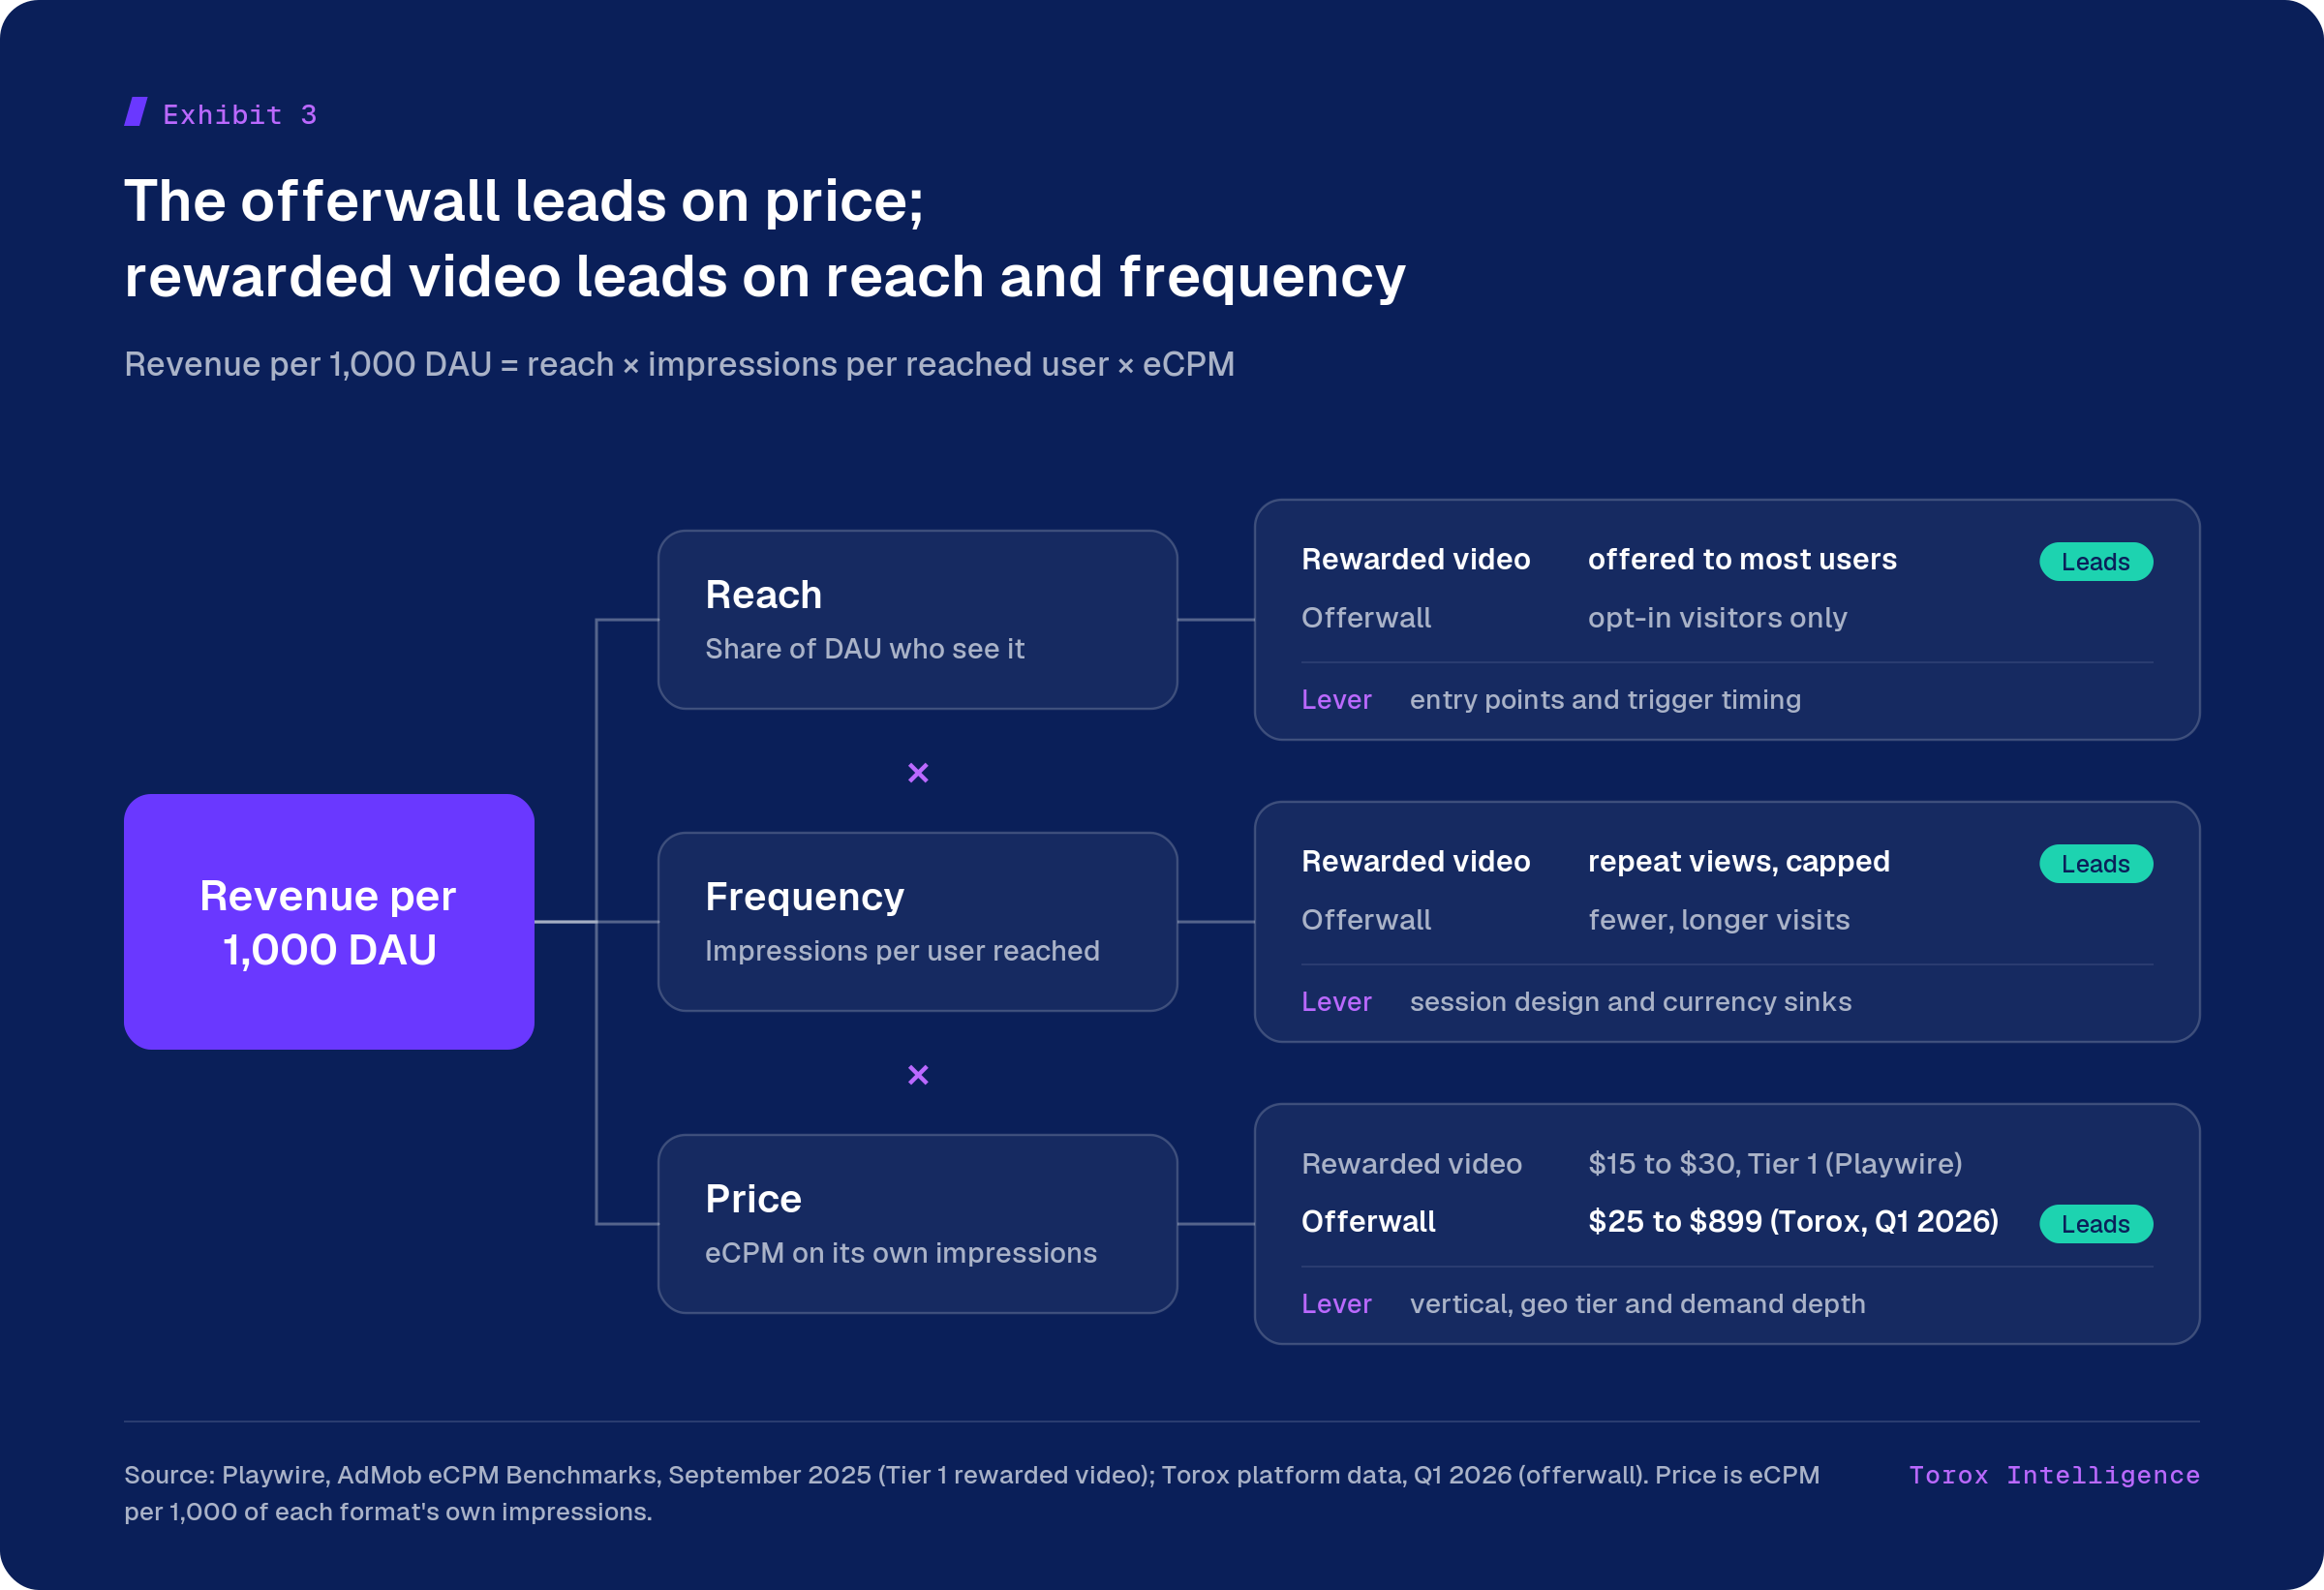
The price gap is fixed by the data: 13 to 26 times at the Torox average. Whether the offerwall out-earns rewarded video on a given app depends on how far its reach and frequency trail.
Solving the revenue identity for reach gives the breakeven: the offerwall impressions needed to match a given rewarded video line.
To use Exhibit 4, divide your daily rewarded video revenue by DAU and multiply by 1,000. Then read across to your subcategory.
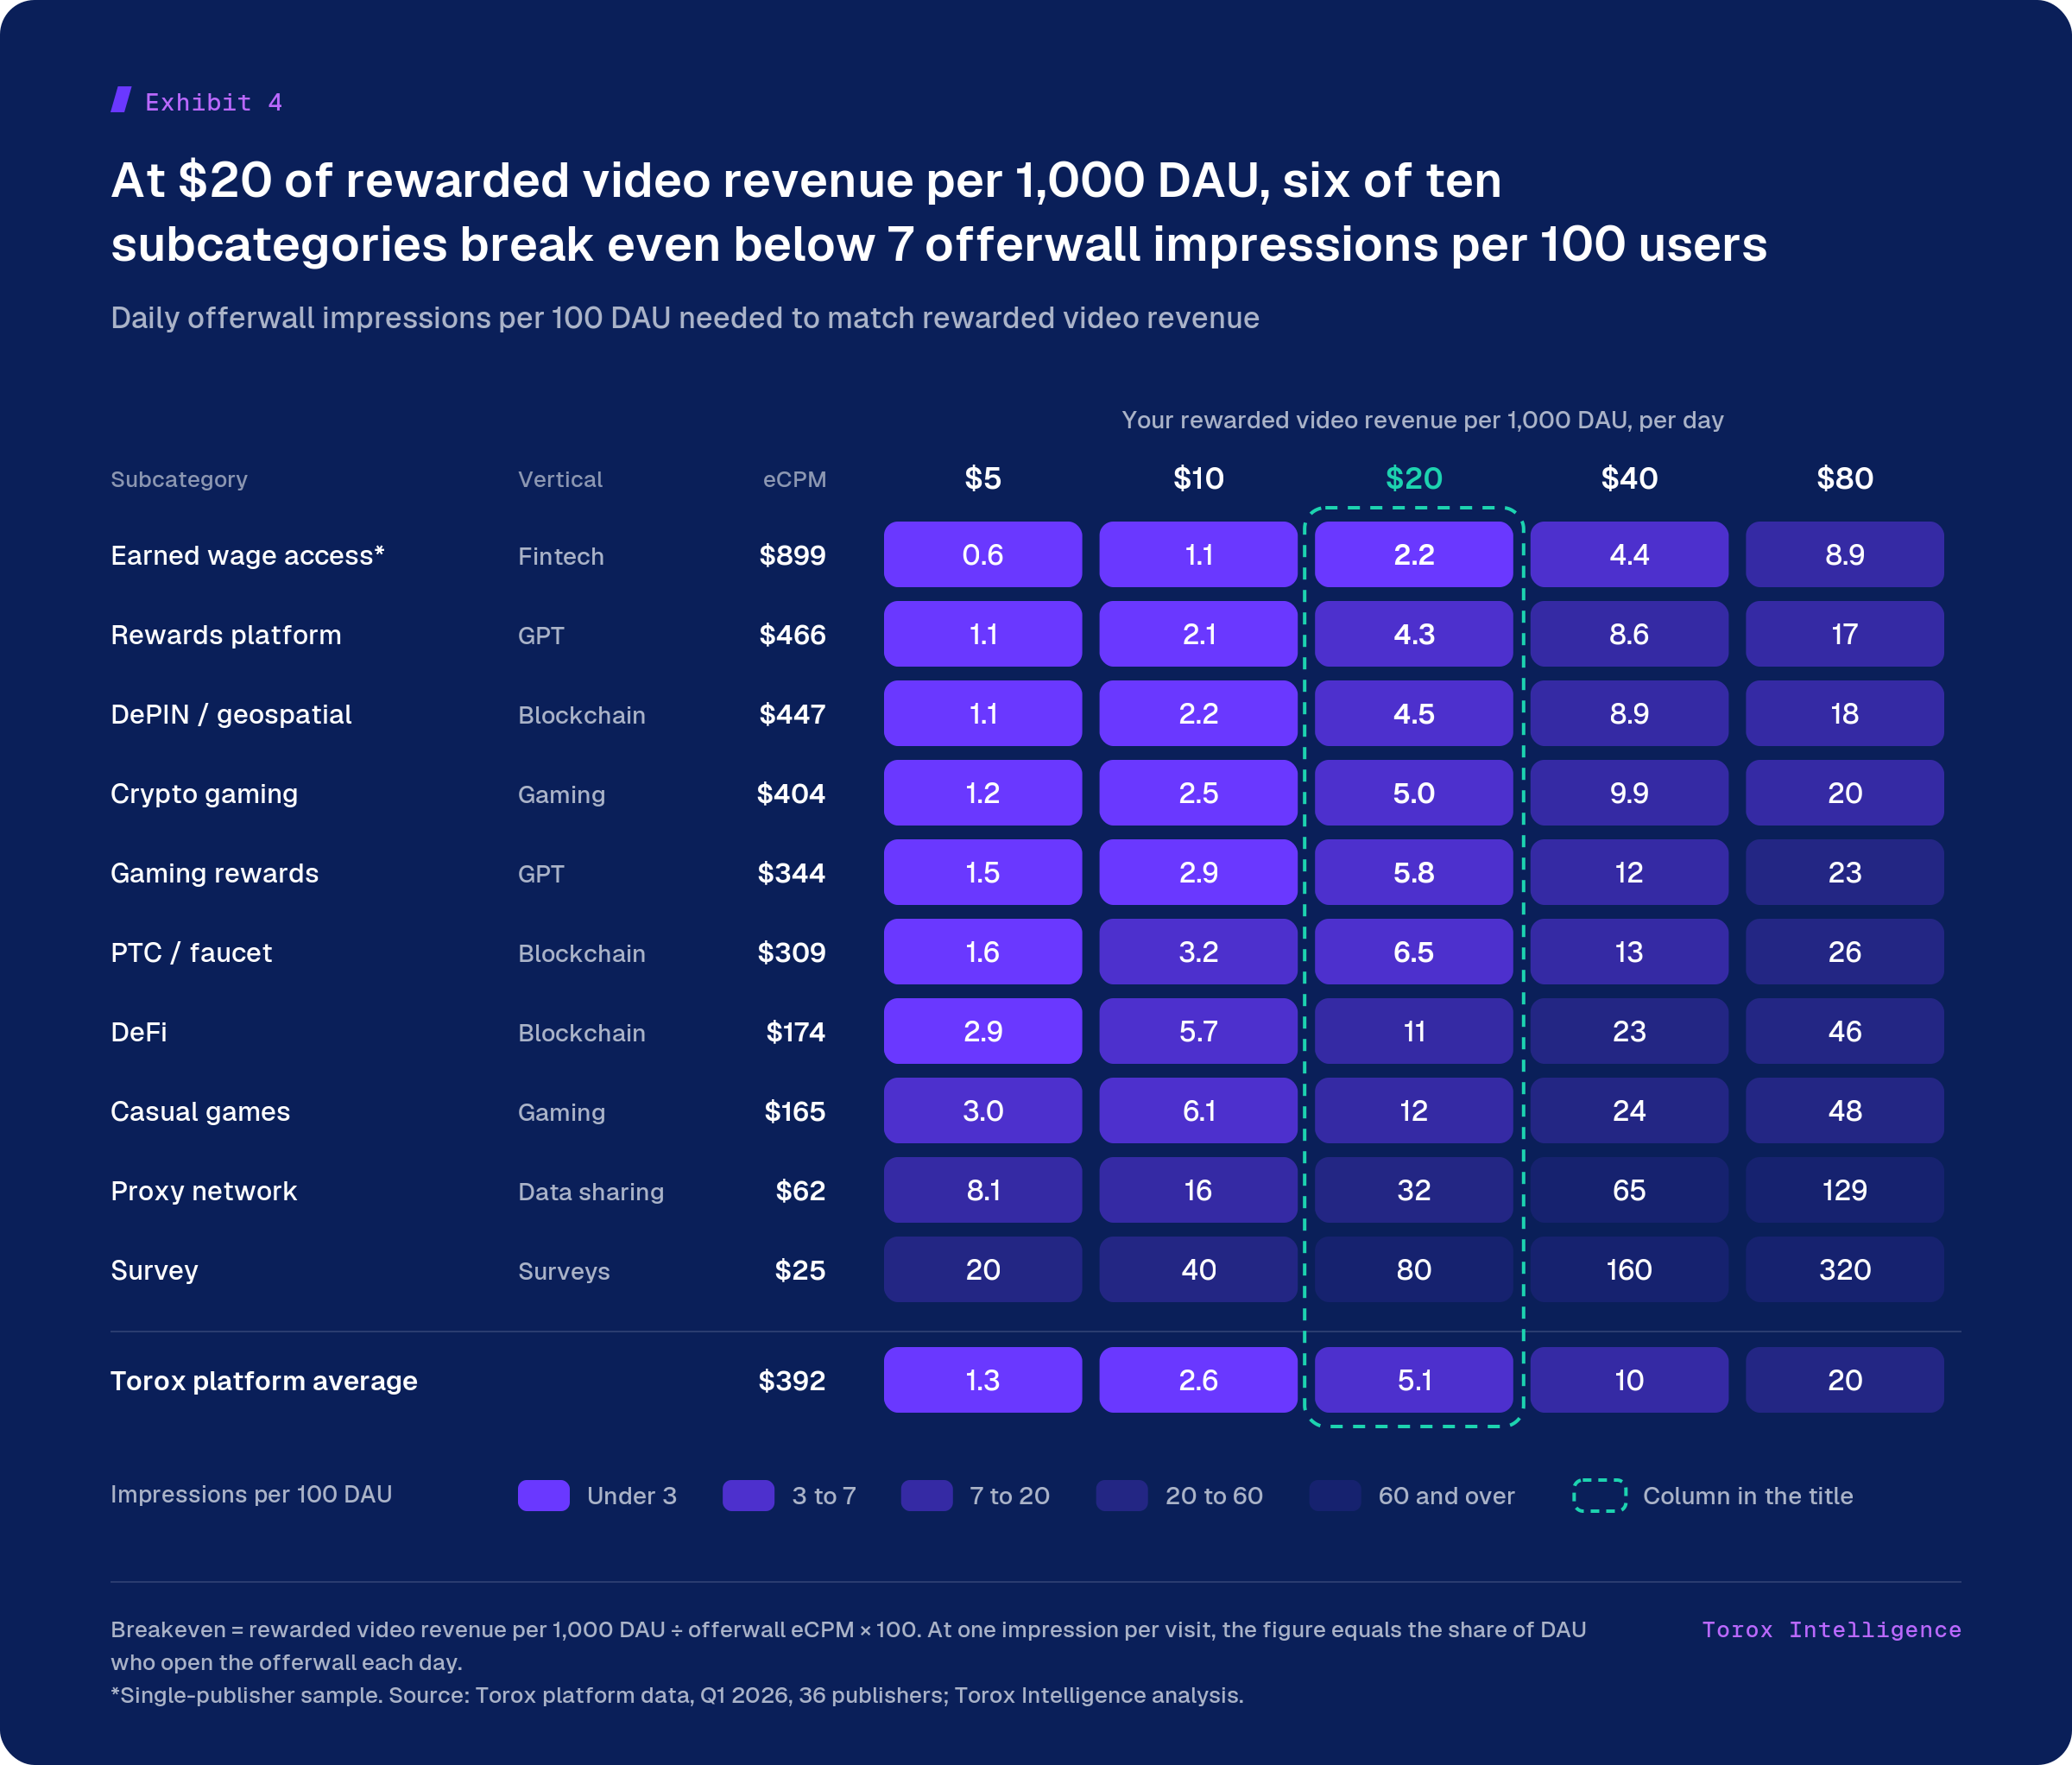
At the Torox average of $392, an offerwall seen by 5 users in 100 each day matches $20 of rewarded video revenue per 1,000 DAU. Survey publishers need 80 impressions per 100 users for the same result, so surveys compete with rewarded video on reach, not price.
The breakeven treats the formats as alternatives. Most apps run them together, so the number that decides the case is what the offerwall adds.
What would an offerwall add to your app?
See your breakeven reach by subcategory and geo tier with the Torox publisher team.
The offerwall’s price varies 36 times across subcategories, so the right mix depends on what the app is. The exchange rate below converts each subcategory’s eCPM into rewarded video views.
| Subcategory | Rewarded views per offerwall impression
0204060
|
Why |
|---|---|---|
| Offerwall-led | ||
| Earned wage access* |
30 to 60
|
Users complete high-value account actions |
| Rewards platform |
16 to 31
|
Users arrive to earn; the wall is the product |
| DePIN / geospatial |
15 to 30
|
Wallet-holding users complete multi-step offers |
| Gaming rewards |
11 to 23
|
Users play to earn, so offers drive the visit |
| PTC / faucet |
10 to 21
|
Task-completion audience; video adds reach |
| Both formats | ||
| Crypto gaming |
13 to 27
|
Sessions carry video; wallets lift offer completion |
| DeFi |
6 to 12
|
Mid-range yield; each format earns a share |
| Video-led | ||
| Casual games |
5.5 to 11
|
Short sessions suit video; the wall monetises the committed minority |
| Proxy network |
2 to 4
|
Low offer value per impression; test the offerwall |
| Either format | ||
| Survey |
0.8 to 1.7
|
Per-impression value is close to rewarded video; decide on reach |
Hypercasual titles are not in the Q1 2026 sample. Their short sessions favour rewarded video’s reach and frequency. An offerwall there needs a currency sink strong enough to send users to it.
Rewarded video and playables sell attention in seconds. The offerwall is a marketplace that carries surveys, installs, in-app events and financial actions side by side.
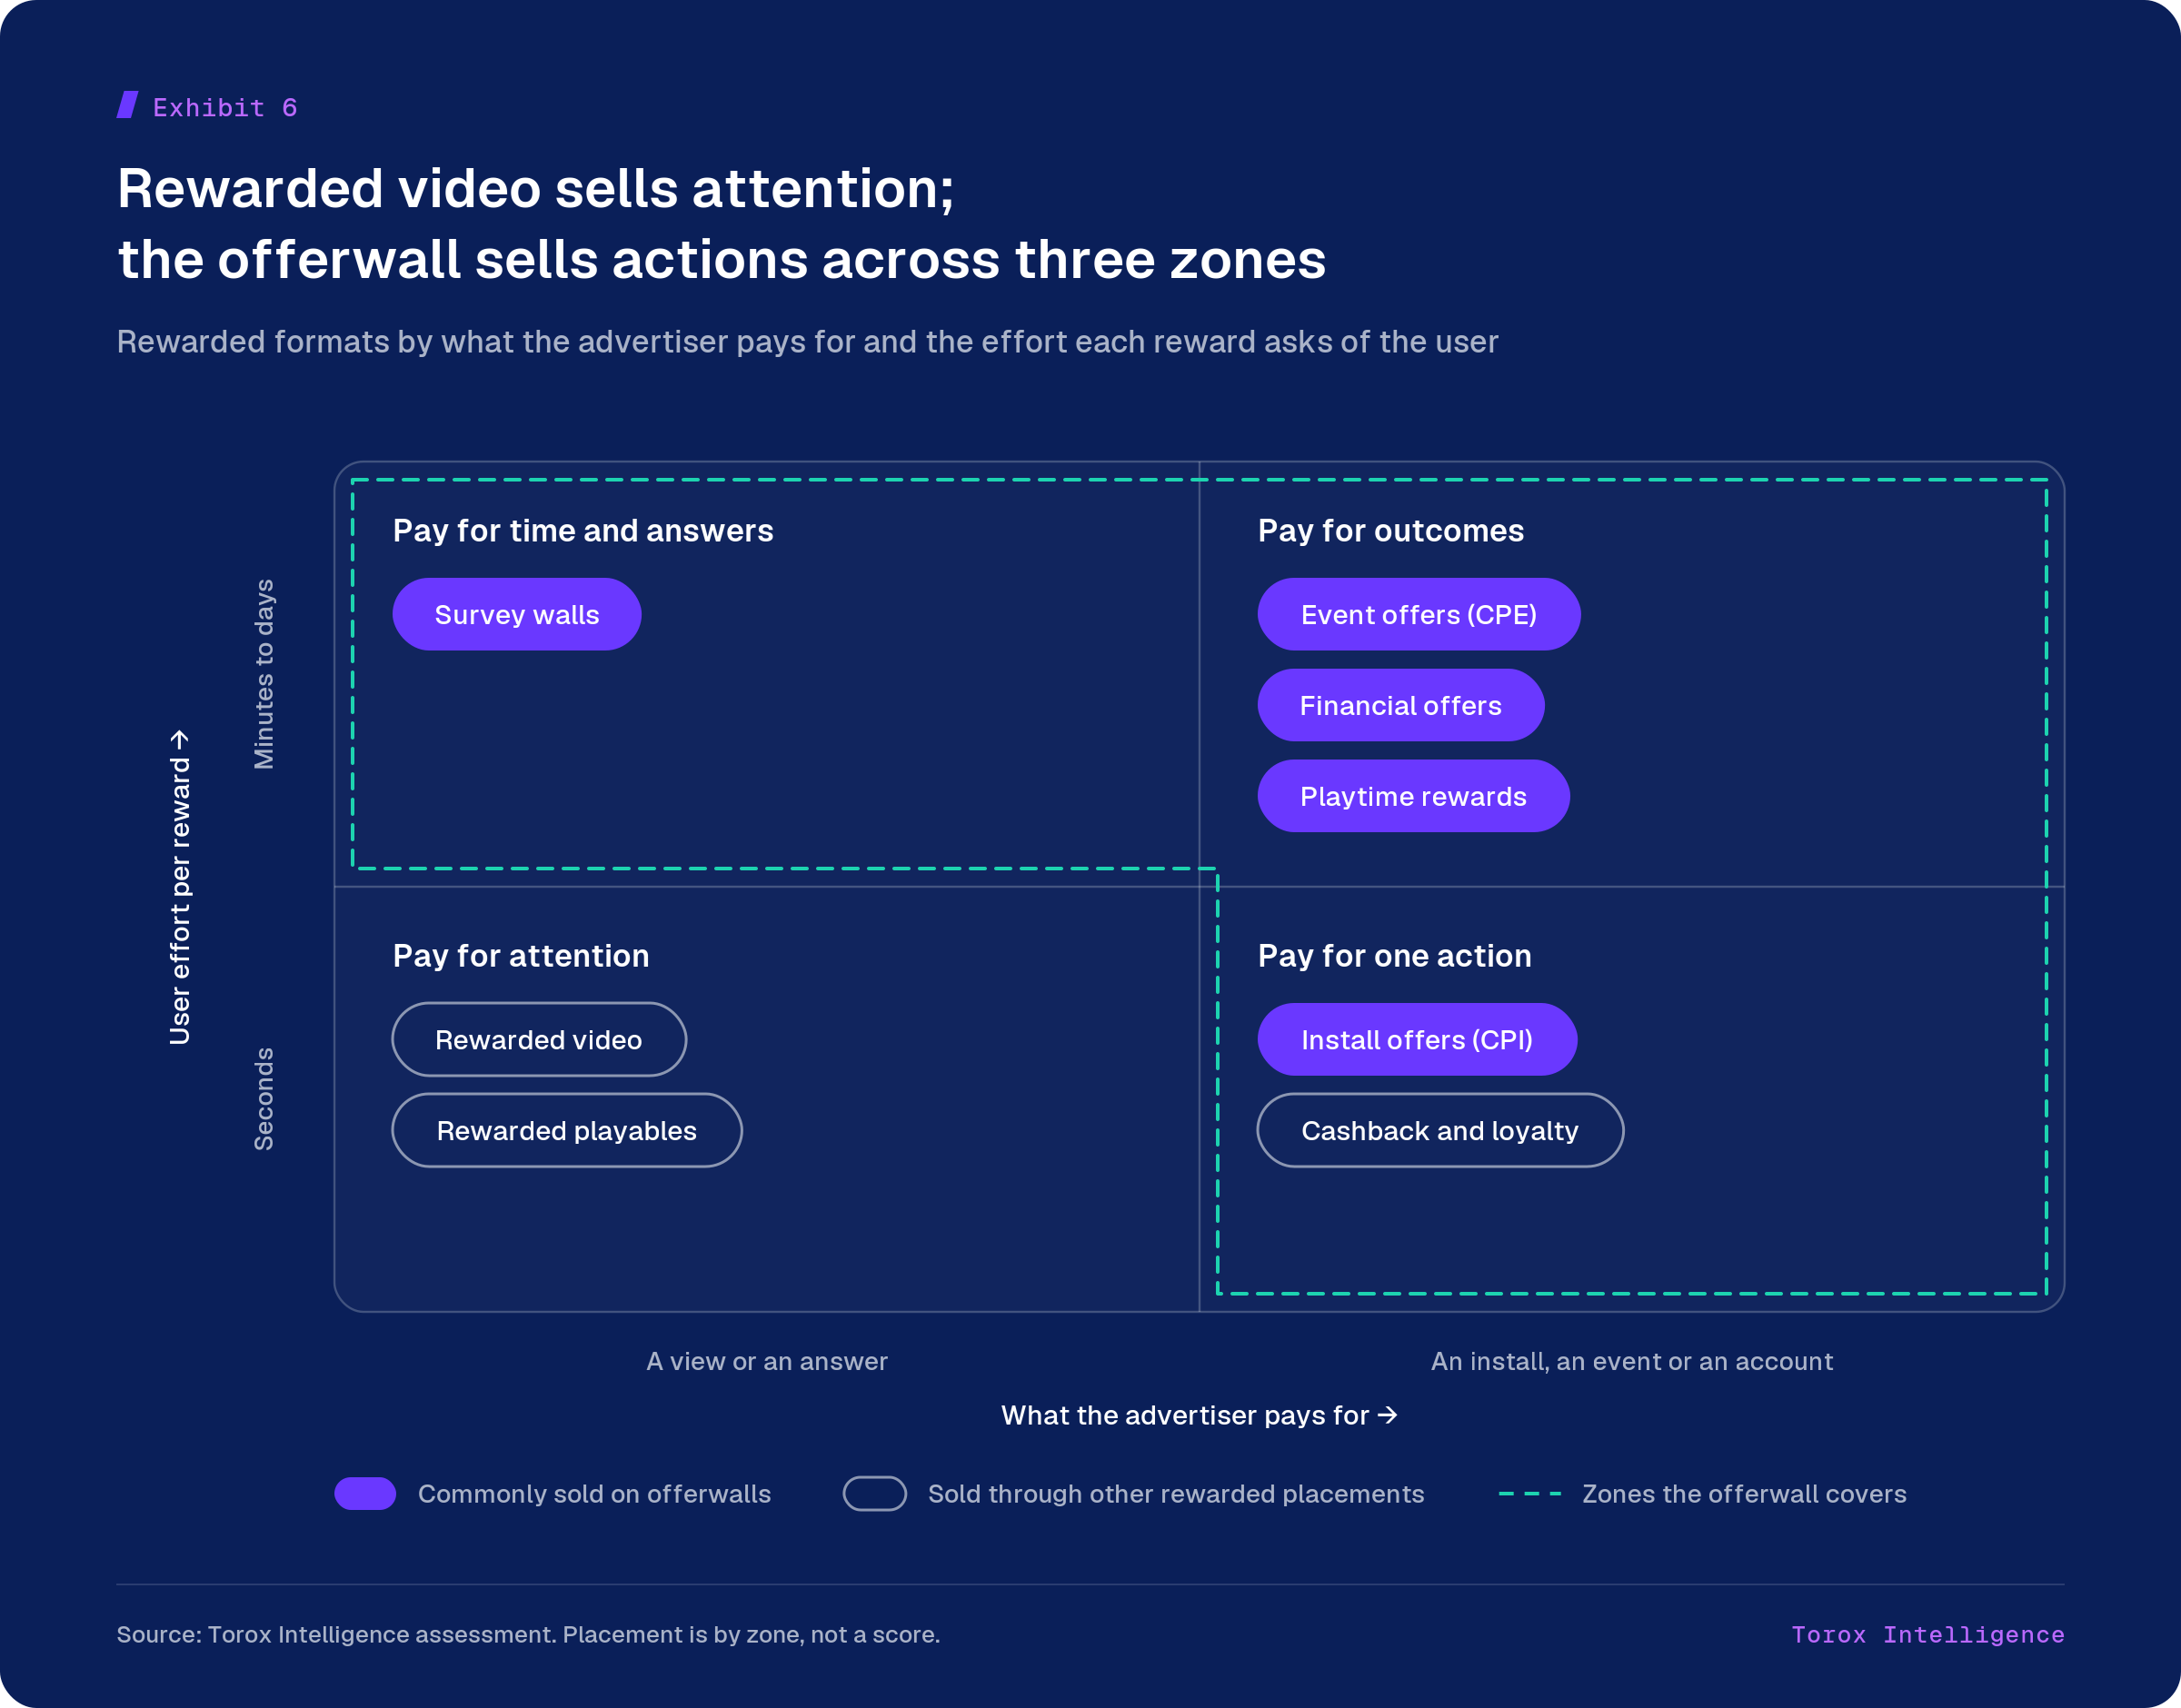
The deeper the action, the more an advertiser pays per completion and the fewer users complete it. Torox data follows the same order: survey publishers averaged $25 per 1,000 offerwall impressions in Q1 2026, and earned wage access $899.
| Source | Advertiser pays for | User effort per reward
SecondsMinutesHoursDays
|
Quality check |
|---|---|---|---|
| Sold on offerwalls | |||
| Install offers | The install (CPI) |
Minutes
|
D1 and D7 retention |
| Survey walls | A completed survey |
Minutes
|
Completion and screen-out rates |
| Playtime rewards | Minutes played in the advertiser’s app |
Minutes to hours
|
Retention by day |
| Event offers | A milestone inside the app (CPE) |
Hours to days
|
Event completion, D30 ROAS |
| Financial offers | An account opened, verified or funded |
Minutes to days
|
Cost per funded account |
| Other rewarded placements | |||
| Rewarded video | A completed view, or an install on CPI demand |
Seconds
|
Completion rate; install retention where CPI-priced |
| Rewarded playables | An interaction or an install |
Under a minute
|
Install retention |
| Cashback and loyalty | A purchase |
The purchase itself
|
Order value, refund rate |
Offerwall eCPM is high because advertisers pay for completed actions whose value they can measure. That price holds only while those actions keep producing paying users.
| Model | Advertiser pays for | Where it runs |
|---|---|---|
| The advertiser carries the conversion risk | ||
| CPM | 1,000 impressions | Rewarded video, interstitials, banners |
| CPV or CPCV | A view, or a completed view | Rewarded video |
| The network and publisher carry the conversion risk | ||
| CPI | An install | Offerwall install offers, some video demand |
| CPE | A named in-app event | Offerwall event offers |
| CPA | A defined action, such as a funded account | Offerwall financial and survey offers |
For a publisher, moving down this table trades certainty for price. The Torox eCPM report found the premium tracks the value of the completed action: fintech advertisers pay for account openings, survey buyers for answers.
In the Merge Paradise campaign, Storytaco paid on CPI for iOS users in the US, while Torox structured CPE events on the back end to steer traffic toward engaged players.
| Supporting metric | February 2026 | March 2026 | Change |
|---|---|---|---|
| Installs | 372 | 424 | +14% |
| IAP share of revenue | 81.5% | 85.5% | +4.0 pts |
| IAP revenue, indexed to February | 1.0 | 2.0 | 2x |
In March, 85.5% of the campaign’s revenue came from in-app purchases. Rewarded users bought inside the game, which is the behaviour a CPE structure is built to select for.
Neither format has a retention effect that this dataset can measure. Treat retention as a test result, not an assumption.
Measure D1, D7 and D30 retention for users exposed to each format against a holdout group.
For most apps the question is what an offerwall adds on top of rewarded video. That depends on how much offerwall revenue is new and how much shifts from existing lines. No public dataset measures that overlap; a holdout test does.
| Cell | Setup | What it answers |
|---|---|---|
|
AControl
|
Current stack, no offerwall | The baseline for revenue and retention |
|
BOfferwall
|
Current stack plus the offerwall at today’s placement | Incremental revenue at current placement |
|
COfferwall, timed
|
Current stack plus the offerwall surfaced at resource depletion | The value of trigger timing |
Run the test for at least 30 days, so D30 retention and delayed CPE revenue are captured. Read four numbers per cell:
Keep the offerwall if cell B or C raises total revenue per 1,000 DAU with D30 retention flat or better. Take the placement from whichever of the two earns more.
Track every format on the same per-user base, then read each format’s own price inside it.
| Metric | Formula | What it tells you |
|---|---|---|
| Decide | ||
| Revenue per 1,000 DAU, by format | Format revenue ÷ DAU × 1,000 | The only cross-format comparison |
| Incremental revenue per 1,000 DAU | Test cell minus holdout | What the offerwall adds |
| Diagnose | ||
| Reach | Users who saw the format ÷ DAU | How much of the base each format touches |
| Frequency | Impressions ÷ users who saw the format | How often those users engage |
| eCPM, by format and geo tier | Revenue ÷ impressions × 1,000 | Price movement within one format |
| Offerwall revenue per opener | Offerwall revenue ÷ openers, over 7, 14 and 30 days | Yield including delayed CPE payouts |
| Protect | ||
| Retention of exposed users | D1, D7 and D30, against a holdout | Whether a format costs engagement |
Data. Offerwall figures come from Torox platform data for Q1 2026: 36 randomly selected publishers across six verticals and three geo tiers. eCPM is publisher earnings divided by offerwall impressions, multiplied by 1,000. Earned wage access is a single-publisher sample and is indicative only.
Benchmarks. Banner, interstitial and rewarded video ranges are Playwire’s Tier 1 benchmarks (September 2025). They are not matched to Torox’s geo mix. eCPM definitions follow the AppsFlyer glossary.
Models. Exhibits 2, 4 and 5 are Torox Intelligence calculations from the figures above. Exhibit 2 uses illustrative daily counts.
Limitations.
Sources
Torox Intelligence is Torox’s ongoing read on rewarded traffic, built on first-party data from the Torox offerwall network. Founded in 2012, the network reaches 9.0M+ monthly active users across 600+ publishers, with 350+ advertisers buying traffic. Integration takes under 24 hours, and publishers are paid on NET 30 terms.
Model your offerwall breakeven
Send your rewarded video revenue per 1,000 DAU and your app category, and the Torox publisher team will model it with you.
It depends on each format’s reach and frequency in your app. At the Torox Q1 2026 average of $392, one offerwall impression earns what 13 to 26 rewarded views earn. An offerwall seen by 5 users in 100 each day matches $20 of rewarded video revenue per 1,000 DAU. Most apps should run both.
Offerwall eCPM counts offerwall impressions, and each one is a visit by a user who chose to earn. Advertisers pay per completed install, event or account action, so each impression carries more value. Rewarded video counts single ad views. The two eCPMs price different units and do not compare directly.
At the Torox Q1 2026 average of $392, one offerwall impression equals 13 to 26 rewarded views at a Tier 1 rewarded video eCPM of $15 to $30. The rate varies by subcategory: about 1 view for survey publishers, 5.5 to 11 for casual games, and 30 to 60 for earned wage access, a single-publisher sample.
Yes. They sell different things: rewarded video sells a view and the offerwall sells an action. Test the addition with a holdout of 10 to 20% of new users for at least 30 days. Keep the offerwall if total revenue per 1,000 DAU rises and D30 retention holds.
The Torox dataset does not measure a retention effect, so treat it as a test result. Earned currency gives users a reason to return, while offers send some users into other apps. The Torox eCPM report found offerwalls surfaced at resource depletion outperform mid-session placements. Compare D7 and D30 retention against a holdout.
It depends on vertical and geography. On the Torox network in Q1 2026, subcategory averages ran from $25 for surveys to $899 for earned wage access, and geo tiers from $130 to $505. Benchmark against your own subcategory and tier, and compare formats on revenue per 1,000 DAU.