Offerwall eCPM is a metric often used by app publishers to evaluate the effectiveness of the revenues received from advertisers on their offerwall inventory; however it has a large variance across different verticals. An offerwall company like Torox, which focuses on traffic with high-intent, with the mix of campaign goals such as CPI or CPE, can deliver higher eCPM figures than traditional impression-based campaigns to the publishers. Torox platform current inventory data reports an average eCPM of $400 to $500, with a wide variance across different Geo locations, with Tier 1 Geos delivering up to $900 eCPM to the publishers. Compared to other forms of rewarded traffic, such as rewarded videos, which provide an average of $15-$30 of eCPM to publishers, the rewarded offerwall eCPM, provides a significantly larger value.
Publishers choosing an offerwall network make this decision partly on expected eCPM. Sometimes these benchmarks are generic, out of date, or not specific to verticals, this can lead to unrealistic expectations or wrong calibration. Therefore our goal for this article is to serve as a publisher’s decision-making guide to identify where the most relevant opportunities within offerwalls in terms of eCPM are, and frame realistic expectations regarding the variance across different categories.
What is offerwall eCPM and how is it calculated?
Offerwall eCPM (effective cost per mille) is the revenue a publisher earns for every 1,000 impressions served through their offerwall, calculated as total earnings divided by total impressions, multiplied by 1,000. It is what publishers “effectively” earn and that’s what the “E” in eCPM (Effective cost per mille) stands for. Compared to the CPM metrics, the eCPM is theother side of the same coin, while CPM refers to advertiser costs and eCPM refers to publisher revenue. An offerwall eCPM differs structurally from the banner or other types of eCPM. Offerwalls are gated by rewards, which means that people who are going through them are oriented and intend to complete tasks or games for rewards, so they are, by definition, high-intent users which have the potential to translate to high-value users. The comparison user pool for the passive formats is completely different, leading to a large difference in the eCPM for publishers.
Offerwall eCPM benchmarks by app vertical – 2026 Torox data
In this report below we have randomly selected 36 publishers from different verticals and categories in Q1 2026. We will be covering their eCPM figures to create a better understanding for future publishers of what they can expect in different categories to receive. We have observed the highest eCPMs from Fintech publishers; however a limitation that should be pointed out in the categories below is that in some cases (Fintech) we don’t have a lot of publishers in the sample. Therefore, these results can showcase the statistics; however they should be taken with a grain of salt in terms of generalization.
The following eCPM figures were pulled from offerwall campaigns run through the Torox network in 2026, Q1 across 36 publishers.
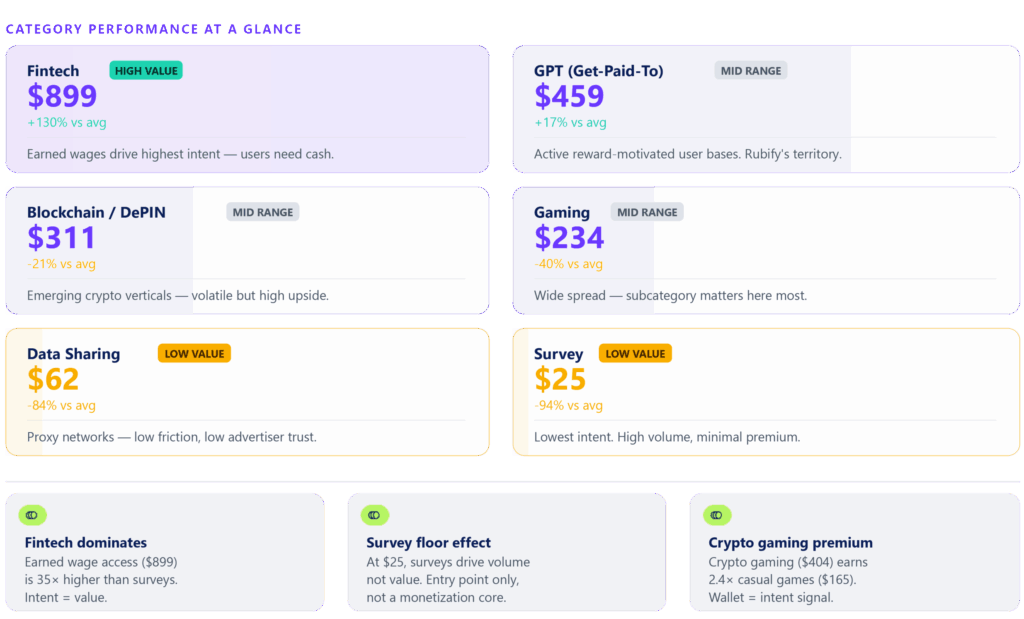
With such a large variance in eCPM across publisher verticals, publisher vertical selection is the single most consequential decision affecting offerwall eCPM, more so than traffic volume, geography, or session frequency. The category breakdown immediately reveals a two-tier structure. Fintech and GPT (Get-Paid-To: rewarded websites that reward task fulfilment, such as reaching levels in a game) sit materially above the platform average, driven by advertisers paying premium CPE bids for users who complete high-value actions: financial onboarding, account registration, reward redemption. Below the average, Gaming, Blockchain/DePIN, Data Sharing, and Survey cluster together, though for structurally different reasons: Gaming underperforms because its subcategories are polarised rather than uniformly weak, Blockchain carries upside but limited sample depth, and Survey represents the market floor by design, where offer friction is near zero and advertiser intent value is minimal. The 36x spread between Fintech ($899) and Survey ($25) is not a performance anomaly, it is the expected output of a system where advertiser bid value is tightly coupled to the downstream economic value of a completed user action. A financial services advertiser whose user just opened a bank account will always outbid a survey provider whose user just answered five questions. What the category chart makes visible is that choosing a vertical is, functionally, choosing an eCPM ceiling.
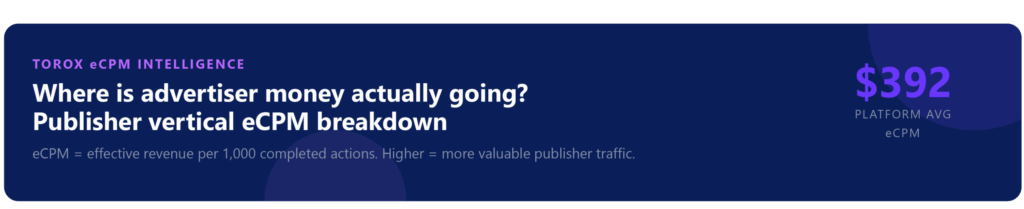
The platform average of $392 is a weighted figure shaped heavily by GPT and spans an 18x internal eCPM spread within a single category alone. This means the platform average is not a reliable baseline for any individual publisher, it is an artefact of sample concentration, not a meaningful target. The more operationally useful reference points are the subcategory figures.
Offerwall eCPM subcategory breakdown
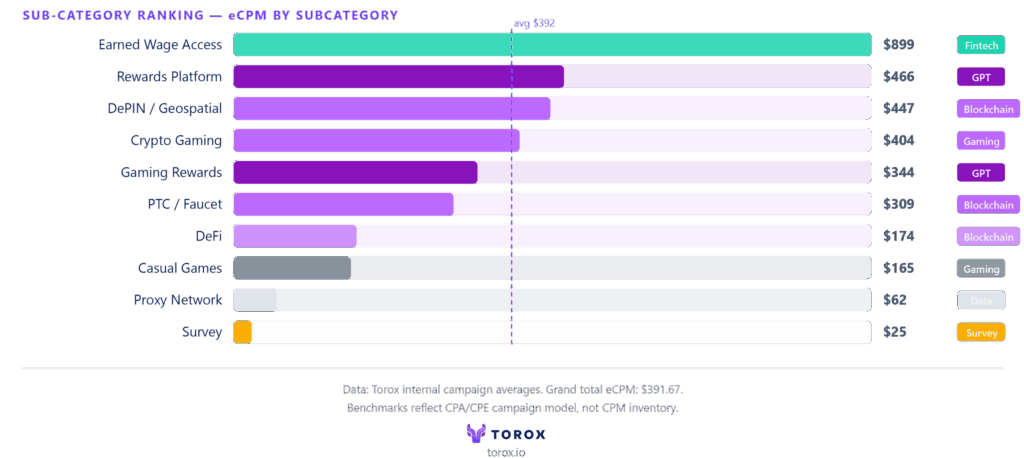
Rewards Platform and DePIN/Geospatial consistently clear the platform average, while PTC/Faucet sits meaningfully below it despite belonging to the same parent categories. For publishers evaluating offerwall monetisation for the first time, subcategory eCPM figures are the correct benchmarks, not category averages. The Gaming vertical makes this point most sharply: Crypto Gaming and Casual Games sit in the same parent category yet deliver a 2.4x eCPM gap, driven entirely by whether users carry wallet infrastructure and complete multi-step offers.
Observing the subcategories, we saw that as part of, for example, the GPT subcategory, the highest eCPM was for end-of-page access type of app and rewarded apps while the lowest would be for surveys as a subcategory and category as well overall.
Offerwall Click volume vs eCPM
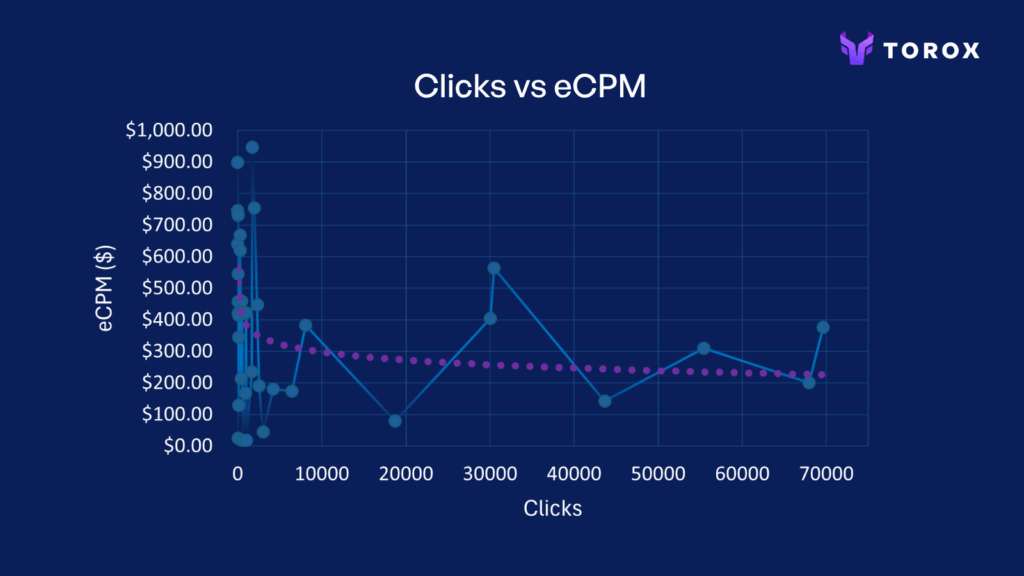
Additionally, we also looked at traffic sources and if higher traffic volume publishers might have higher or lower eCPM. What we saw was that with a lower click traffic there is a larger variance, where there are publishers getting significantly higher and lower eCPM. As the traffic volume increases it stabilizes so the results are more averaging out, so they are more normalized. So again we wouldn’t say that publishers that provide more traffic or less traffic have higher potential for eCPM. What we see is more of a customization, where some niche publishers can drive high-value traffic and therefore receive high eCPM. With a larger volume of traffic the results are more expected and potentially slightly lower than with these highly customized high-value niche publishers.
Curious what eCPM your app vertical can achieve?
See how publishers in your category are performing on the Torox network in 2026.
What factors create the biggest eCPM differences between verticals?
The three factors that can explain vertical eCPM variance in the Torox publisher dataset are
1. User intent at the moment of offer presentation
2. Advertiser bid competition in that vertical
3. The structural strength of the in-app reward mechanism.
Together these three factors explain why Fintech publishers achieve the highest eCPMs in the dataset, and why end-of-page access apps outperform survey-based GPT apps even within the same category.
Within the Torox data, the GPT subcategory demonstrates the user intent effect most clearly. End-of-page access apps and rewarded app integrations delivered the highest eCPMs in the GPT category, while survey apps delivered the lowest. The distinction is not the app category itself but the user’s state at the moment of offer presentation: a user unlocking premium access has an immediate, felt need to complete a task. A survey completer is fulfilling an abstract requirement with no immediate in-app payoff. Completion rates follow intent directly, and eCPM follows completion rates.
Apps with persistent, valued in-app currencies create self-renewing user motivation for offerwall engagement. A casual RPG player who depletes their stamina currency will return to the offerwall the next session, and the session after. By contrast, a one-time unlock offer (remove ads, unlock premium) creates no recurring engagement with the offerwall mechanic. Publishers whose currency design makes users consistently want more are operating in fundamentally better structural conditions for offerwall eCPM than those treating the offerwall as a single-session monetisation event.
How does offerwall eCPM compare to other mobile ad formats?
Offerwalls structurally outperform passive ad formats because the user pool is categorically different. Torox platform data shows an average publisher eCPM of $400-$500, compared to the $15-$30 industry average reported for rewarded video. That gap is not marginal, it reflects the difference between a user who has actively opted in and chosen to complete a task for an in-app reward versus a user who was served an impression in the background of their session. The opt-in requirement filters for intent, and intent is what advertisers are paying for when they set CPE bids.
The exception worth noting is hypercasual gaming. In this vertical, sessions are short and in-app currency loops are shallow, which means rewarded video can match or exceed offerwall eCPM because users are conditioned to watching a 30-second ad to continue play but are less motivated to complete a multi-step task-based offer. Publishers in this vertical should evaluate their specific session data before assuming offerwall outperforms video across the board. For publishers in higher-engagement categories, the comparison strongly favours offerwalls. This has also been supported by the Torox analysis of the publishers, where we see below-average eCPM for the gaming vertical.
What other factors affect your offerwall eCPM beyond vertical?
Beyond vertical, four factors consistently shift offerwall eCPM: user geography, time of year, integration placement timing within the app, and advertiser fill rate.
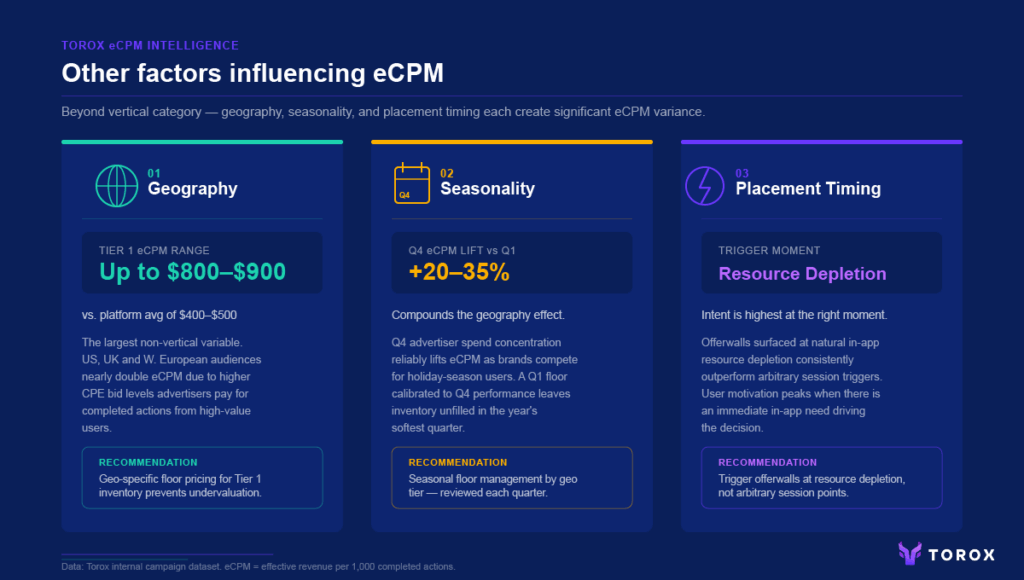
Geography is the single largest non-vertical variable in the Torox publisher dataset. Tier 1 publishers, those with primarily US, UK, and Western European audiences, can achieve up to $800-$900 eCPM against a platform average of $400-$500. That near-doubling is driven entirely by the CPE bid levels advertisers in those markets are willing to pay for a completed action from a high-value user. A publisher with a mixed US/APAC audience is blending two fundamentally different eCPM profiles into a single reported number, which can obscure where performance is strong and where it is weak.
How much does geography actually move the number?
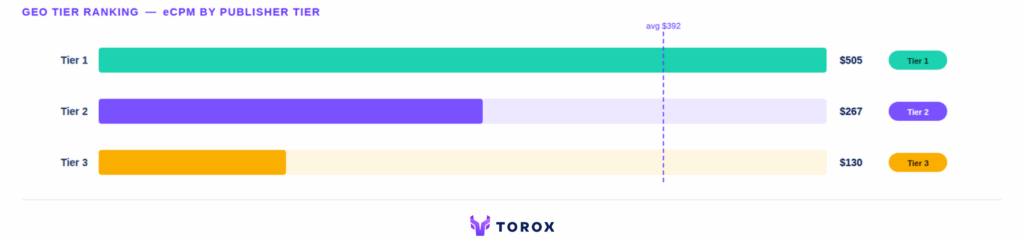
Geography is the largest non-vertical related variable in the Torox publisher dataset, and the figures confirm it with a near-4x range across tiers. One important caveat before reading these numbers: the results reflect the specific mix of publishers on the Torox network in Q1 2026, so they should be read as directional benchmarks rather than universal industry figures. With that said, Tier 1 publishers, those with primarily US, UK, Canadian, and core Western European audiences, average $505 eCPM in aggregate. Tier 2 publishers average $267, roughly half that figure. Tier 3 publishers average $130, and segments such as RU/CIS sit at $17, which falls below even the Survey category floor of $25. The reason is straightforward: advertisers in high-value markets pay significantly higher CPE bids for completed actions from users in those markets, because the downstream economic value of that user to their business is higher. A publisher blending a Tier 1 US audience with a Tier 3 audience into a single reported eCPM is averaging two fundamentally different revenue profiles and, in doing so, obscuring both. Geo-specific floor pricing, setting higher minimum bids for Tier 1 inventory rather than applying a single global floor, is the direct operational response and prevents the most valuable impressions from being undervalued against the broader geo mix.
Seasonality compounds the geo effect predictably. Q4 advertiser spend concentration reliably lifts eCPM 20-35% above Q1 levels as brands across all categories compete for holiday-season users. Publishers should build this into their floor price settings: a Q1 floor calibrated to Q4 performance will leave significant inventory unfilled during the year’s softest quarter, while a Q4 floor set too conservatively undervalues peak inventory.
Torox data shows a consistent pattern in the relationship between traffic volume and eCPM: at lower click volumes there is a wider variance, with some niche publishers achieving significantly above-average results while others sit below. As volume increases, results normalise toward the platform mean. This means small, highly targeted publishers are not structurally disadvantaged by their size, they can achieve premium eCPM through the quality of their user intent even without large scale. On integration timing: offerwalls surfaced at the natural moment of in-app resource depletion consistently outperform those triggered at arbitrary session points, because user motivation to complete an offer is highest when they have an immediate in-app need driving the decision.
How can publishers improve their offerwall eCPM?
Publishers have four concrete levers to improve offerwall eCPM. Torox publisher data makes clear that the largest gains typically come from the first two, both of which are entirely within the publisher’s control and cost nothing to implement beyond an integration adjustment.
Trigger timing is the highest-impact lever. Torox data confirms that offerwalls surfaced at the exact moment a user depletes their in-app resource (lives, energy, premium currency, feature access) consistently outperform mid-session placements, because user motivation to complete a task is highest at the point they have an active need.
Geographic prioritisation is the second lever: publishers with mixed geo audiences should implement Tier 1-specific floor prices to protect the $800-$900 eCPM potential of US and Western European users, rather than blending them into a single global floor that undervalues that inventory against its actual market rate.
Offer type selection is the third lever. Torox data from the GPT subcategory shows end-of-page access and rewarded app integrations consistently outperforming survey formats because the intent profile of users actively seeking an unlock is categorically higher. Publishers who can shift their offer mix toward task-completion and access-unlock formats will see a direct eCPM improvement without changing their advertiser relationships. The fourth lever is advertiser pool breadth: working with a network that aggregates multiple advertiser types creates internal bid competition that structurally improves eCPM over time, particularly for Tier 1 geo inventory where advertiser demand is highest and bid differentiation is most pronounced.
Curious what eCPM your app vertical can achieve?
Speak to our publisher team and get a custom eCPM estimate for your app category and geo.
A good offerwall eCPM on a quality CPE-based network like Torox averages $400-$500 across all publishers and verticals in 2026, with Tier 1 geo publishers regularly achieving $800-$900. Fintech publishers reach the top of that range due to premium advertiser CPE bids. If your eCPM sits materially below the platform average, geo mix, offer type, and trigger placement are the first three variables to examine. All are addressable without changing your ad network.
Offerwall eCPM is structurally different from banner eCPM because the user pools are not comparable. Offerwall users have opted in and are actively completing a task for an in-app reward. They are, by definition, high-intent. Banner impressions are served passively to all users regardless of their engagement state. Torox platform data shows a $400-$500 average offerwall eCPM against the $15-$30 typically reported for rewarded video and significantly lower for standard banners, with the entire gap explained by this intent difference, not by ad format mechanics.
Torox publisher data confirms this pattern directly. At lower traffic volumes, eCPM variance is wide. Some niche publishers achieve significantly above-average figures while others fall below the mean. As volume increases, results normalise toward the platform average. The mechanism: broader volume brings in a wider user mix, including lower-intent users from lower-CPE geographies, which dilutes the per-impression average. Total revenue can still grow even as eCPM falls. The two metrics are not the same and should not be optimised as if they were.
Based on Torox platform data from 36 publishers across categories in 2026, Fintech publishers generate the highest offerwall eCPMs. Within the GPT category, end-of-page access apps and rewarded app integrations outperform survey-based models significantly. The common factor across all top-performing categories is advertiser CPE bid value: advertisers who pay premium rates for a completed action do so because the downstream economic value of that user to their business is high, and that bid premium flows directly to publisher eCPM.
Yes, and significantly. Q4 (October to December) is when advertiser CPE bids increase across all categories as brands compete for holiday-season users, pushing Torox platform eCPMs to their annual peak. Q1 is consistently the softest quarter as advertiser budgets reset. Publishers should set geo-specific floor prices seasonally: a Q4-calibrated floor applied in Q1 will leave inventory unfilled, while a Q1-calibrated floor in Q4 undervalues peak inventory. A 20 to 35% Q1-to-Q4 variance is a reliable baseline expectation across most verticals on the Torox network.
To learn about the cookies we use and information about your preferences and opt-out choices, please click here. By using our platform you agree to our use of cookies.